Monitoring the CPU/GPU Status
You can monitor the usage status of the CPU/GPU on the [Resource Monitor] screen.
Press ![]() (Account) > [Resource Monitor] on the [Dashboard] screen to display the [Resource Monitor] screen.
(Account) > [Resource Monitor] on the [Dashboard] screen to display the [Resource Monitor] screen.
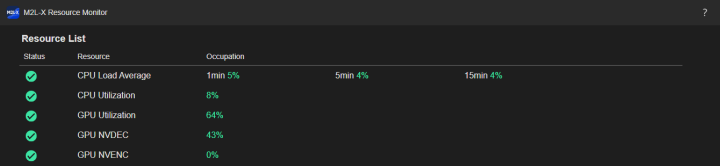
The usage status of the CPU/GPU is displayed on the [Resource Monitor] screen.
- [CPU Load Average]: Displays the CPU usage status as average values over 1 minute, 5 minutes, and 15 minutes.
- [CPU Utilization]: Displays the CPU usage status.
- [GPU Utilization]: Displays the GPU usage status.
- [GPU NVDEC]: Displays the GPU NVDEC usage status.
- [GPU NVENC]: Displays the GPU NVENC usage status.
Hint
- Icons are displayed according to the status of each resource.
-
 (Normal) indicates normal operation.
 -
 (Caution) indicates that the load is high.
 -
 (Error) indicates that dropped frames or an image freeze may occur in the output due to resource constraints.
(Caution) or (Error) state, consider reducing the load by reducing the number of input/output signals and/or lowering the bit rate. -
- Icons indicating the resource status are displayed on the [Live Operation] screen.
TP1001871931