BL-FlowSOM Function
BL-FlowSOM is a clustering function to group data according to the degree of similarity between the data. It speeds up FlowSOM, which is widely used for flow cytometry analysis (see the following paper for the details), by using a newly developed algorithm.
With the BL-FlowSOM function, you can select the star, population pie, and median marker value graph modes. In addition, the expression level of each marker of extracted clusters can be visualized on a heatmap.
- For details about the operation, see “Analyzing by Learning Samples” in “Analysis Using the BL-FlowSOM Function.”
S. V. Gassen, B. Callebaut, et al. "FlowSOM: Using self-organizing maps for visualization and interpretation of cytometry data", Cytometry Part A 87.7, 636-645, 2015.
K. Quintelier, A. Couckuyt, et al. "Analyzing high-dimensional cytometry data using FlowSOM", Nature Protocols 16, 3775-3801, 2021.
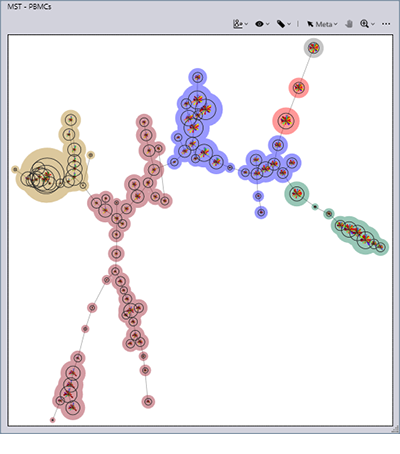
Star
This mode visualizes the expression levels of multiple markers.
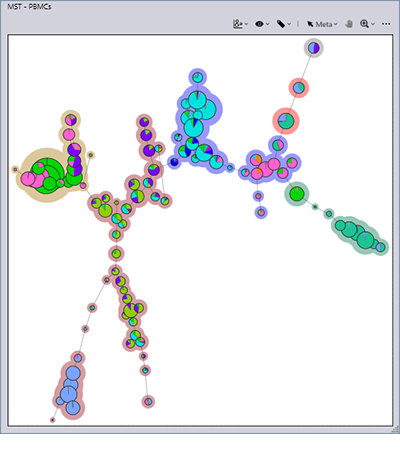
Population pie
This mode visualizes the proportions of cell populations.
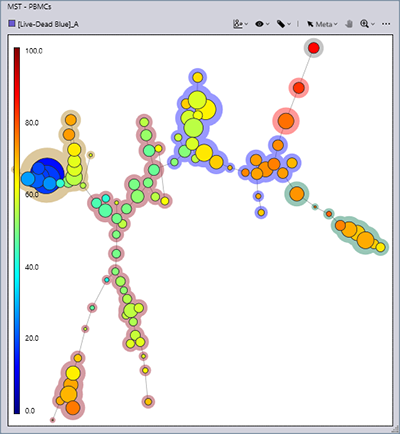
Median marker value
This mode visualizes the expression level of the marker of one type.
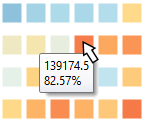
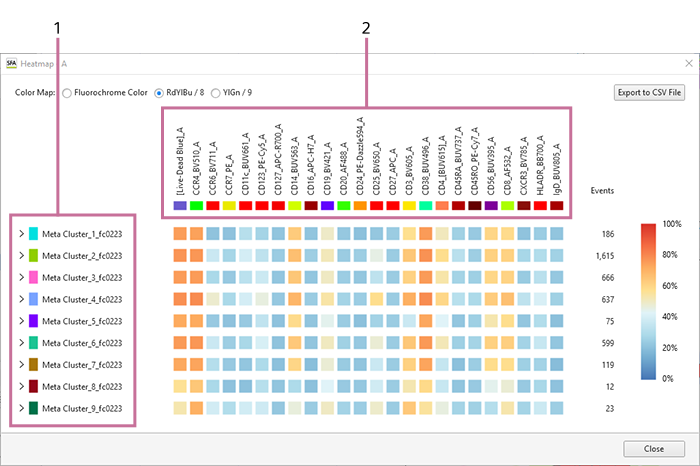
Heatmap
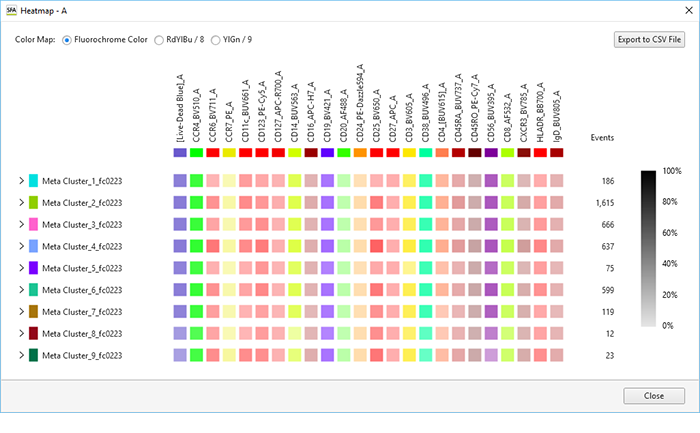
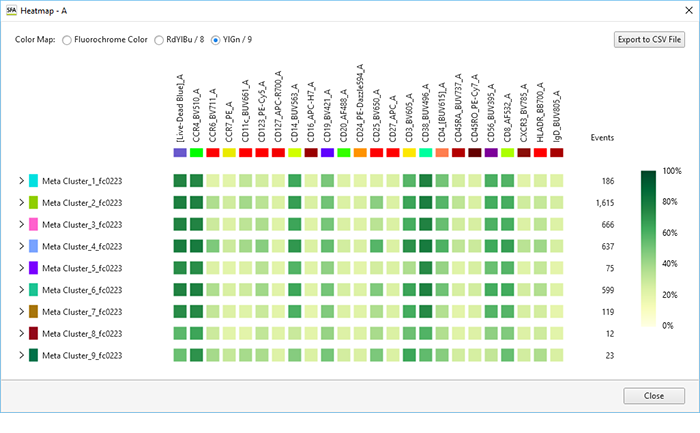
The expression level of each marker of extracted meta clusters and clusters can be visualized on a heatmap. Furthermore, you can also change the type of color map (Fluorochrome Color, RdYlBu/8, and YlGn/9). In addition, the median values (percentage indications) displayed on the heatmap can be output as a CSV-format file.
If you hover the mouse cursor over a color square of the color map, you can check the median value (percentage indication).
RdYlBu/8
- Meta cluster selected in [Gate Manager] or an MST plot
- Fluorochrome selected in the legend of a star chart
Fluorochrome Color
YlGn/9
- For details, see “Displaying the Heatmap.”