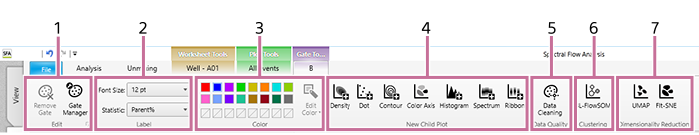
[Gate Tools] Tab (Ribbon)
The [Gate Tools] tab of the ribbon has the following buttons.
-
[Edit]
These buttons are used to edit the selected gate.
[Remove Gate]
Removes the selected gate.
[Gate Manager]
Allows managing and configuring the selected gate. Clicking this button displays the [Gate Manager] dialog. See “[Gate Manager] Dialog”.

Displays the properties of the selected gate. You can change the setting of each parameter, as required. Clicking this button displays the [Gate Properties] dialog. See “[Gate Properties] Dialog”.
-
[Label]
These buttons make settings related to gate labels.
[Font Size]
Selects the font size of text.
[Statistic]
Selects the statistic information that is displayed for gates.
-
[Color]
This group is used to change the colors of gates.
Color Palette
Changes the color of the selected gate.
[Edit color]
Changes a color in the palette to a custom color. Click a color in the color palette, click the [Edit Color] button, then select a new color, and click [Apply].
-
[New Child Plot]
These buttons are used to add a new child plot.
[Density]
Adds a new density plot.
[Dot]
Adds a new dot plot.
[Contour]
Adds a new contour plot.
[Color Axis]
Adds a new color axis plot.
[Histogram]
Adds a new histogram plot.
[Spectrum]
Adds a new spectrum plot.
[Ribbon]
Adds a new ribbon plot.
-
[Data Quality]
Configures settings related to data quality.
[Data Cleaning]
Removes events containing noise and outliers.
- For details about the operation, see “Removing Events Containing Noise and Outliers (Data Cleaning Function)” in “Analysis Using the Dimensionality Reduction Function.”
-
[Clustering]
Analyzes data by using the clustering function to extract a cell population automatically.
- For details about the operation, see “Analyzing by Learning Samples” in “Analysis Using the BL-FlowSOM Function.”
[BL-FlowSOM]
Analyzes data by using BL-FlowSOM. Clicking this button displays the [BL-FlowSOM] dialog. See “[BL-FlowSOM] Dialog”.
-
[Dimensionality Reduction]
Analyzes data by using the dimensionality reduction function to “compress” multi-dimensional cell data to display it on a two-dimensional plot.
- For details about the operation, see “Analyzing by Learning Samples” in “Analysis Using the Dimensionality Reduction Function.”
[UMAP]
Analyzes data by using UMAP. Clicking this button displays the [UMAP] dialog. See “[UMAP] Dialog”.
[FIt-SNE]
Analyzes data by using FIt-SNE. Clicking this button displays the [FIt-SNE] dialog. See “[FIt-SNE] Dialog”.