Adding Gates
You can separate events into groups by drawing gates around the events on plots. Gates of different types (Rectangle, Ellipse, Polygon, Quadrant, Linear) are available which can be drawn to match the distribution of events. Adding a gate allows you to display a new plot representing the population of events that fall within the gate.
- Select a plot on which to add a gate.
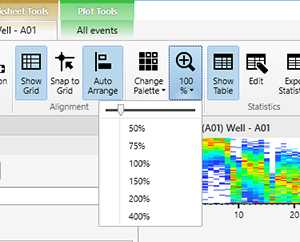
Zoom in on the plot, as required, using controls in the [View] group on the [Worksheet Tools] tab of the ribbon to make it easier to draw the gate on the plot.

- Click the button for desired gate type to surround the target population in the [New Gate] group on the [Plot Tools] tab of the ribbon, and draw a gate on the plot.
Alternatively, right-click the plot, then select the gate type from [Insert Gate] in the context menu.

[Rectangle]: Adds a rectangle gate.
[Ellipse]: Adds an ellipse gate.
[Polygon]: Adds a polygon gate.
[Quadrant]: Adds a quadrant gate. Quadrant gates are added with the intersection point of the quadrants at the position of the mouse click. Gates “<gate_name>-Q1” to “<gate_name>-Q4” are added to the four quadrants on the plot. Drag the intersection point to change the size of the quadrants.
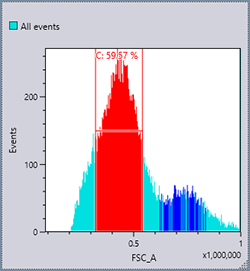
[Linear]: Adds a linear gate. Linear gates can be added to histogram plots only.
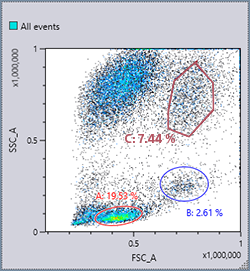
The gate is added to the plot and the population percentage statistic for the gate is displayed.
Example: Polygon gate

Example: Linear gate

- Edit the name of the gate, the displayed statistic, color, and other preferences, as required.
Select the gate, click [Gate Manager] or
 in the [Edit] group on the [Gate Tools] tab of the ribbon, and configure the settings in the displayed dialog.
[Gate Manager]: Displays the [Gate Manager] dialog. For details about the setting items, see “[Gate Manager] Dialog.”
 : Displays the [Gate Properties] dialog. You can perform the same operation from the right-click context menu. For details about the setting items, see “[Gate Properties] Dialog.”

