Visualizing the Proportions of Cell Populations
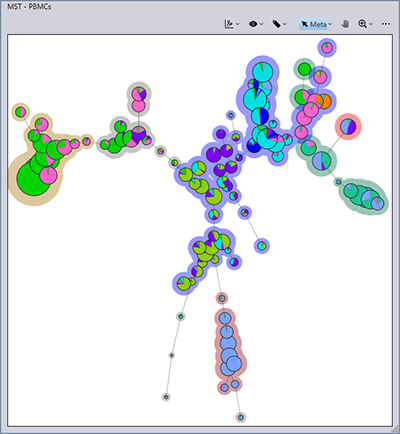
Population pie allows you to visualize the proportions of the cell populations selected in the [Gate Manager] dialog.
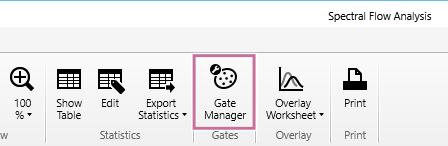
- Select [Gate Manager] in [Gates] on the [Worksheet Tools] tab of the ribbon.
The [Gate Manager] dialog appears.
- In the [Paint] column, place check marks in the checkboxes for the cell populations you want to visualize.
Change the color of the cell populations in [Color], as required.
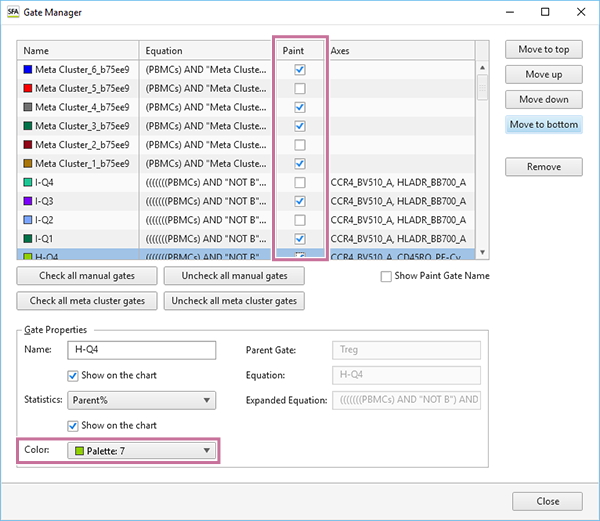
Color is applied only to the selected cell populations.
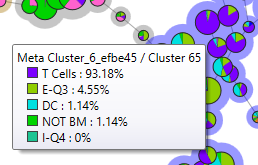
In addition, if you hover the mouse cursor over the population pie, you can check the proportion of the cluster star for each gate.