Finding Autofluorescence Populations
You can find the autofluorescence spectrum in acquisition data by searching for the autofluorescence populations.
Hint
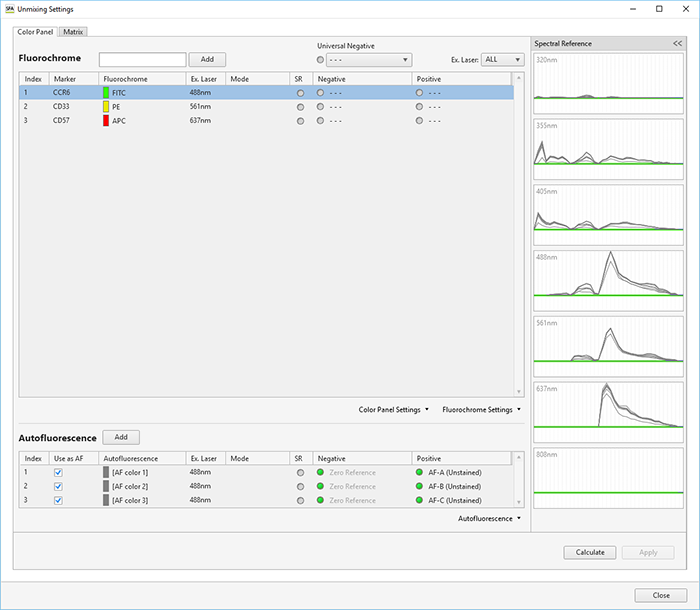
- The [Autofluorescence] tab of the [Unmixing Settings] dialog and the worksheet are updated after using the Autofluorescence Finder.
- Display the worksheet for the well/tube whose autofluorescence populations you want to find.
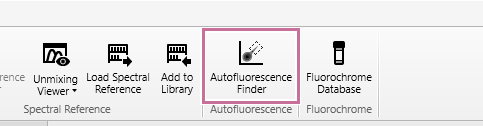
- Click [Autofluorescence Finder] in the [Autofluorescence] group on the [Unmixing] tab of the ribbon.
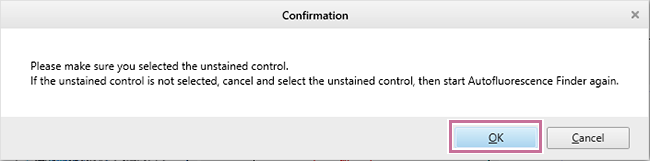
A message appears to confirm whether the unstained control for which you want to find autofluorescence is selected.
- Check that the well/tube of the unstained control is selected, then click [OK].
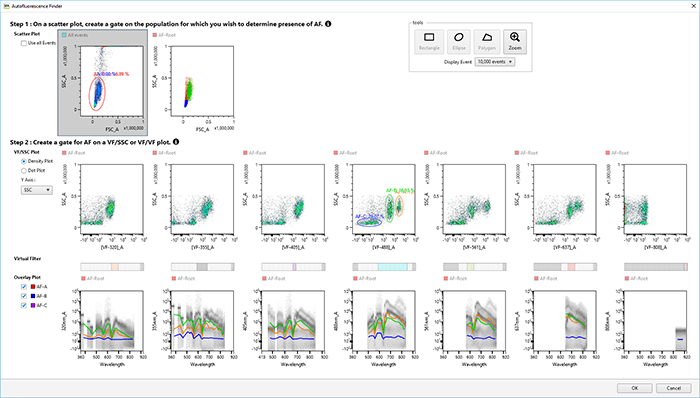
The [Autofluorescence Finder] dialog appears.
- In [Step 1], add the appropriate gates to the FSC/SSC plot.
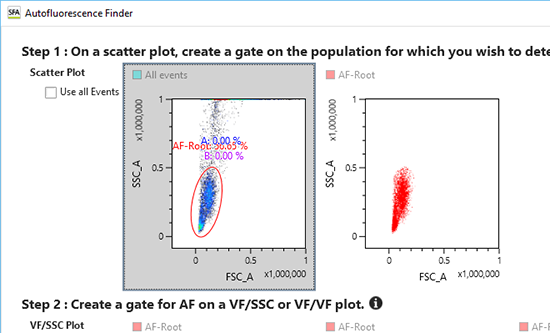
The added gate automatically is reflected as the parent gate in [Step 2].
Hint
- Gate the corresponding populations to make later adjustment easier.
- You can adjust the axis settings on a plot (maximum value, minimum value, Biexponential axis parameter) by dragging the axis on the plot.
- To select all events without adding a new gate, place a check mark in [Use all Events].
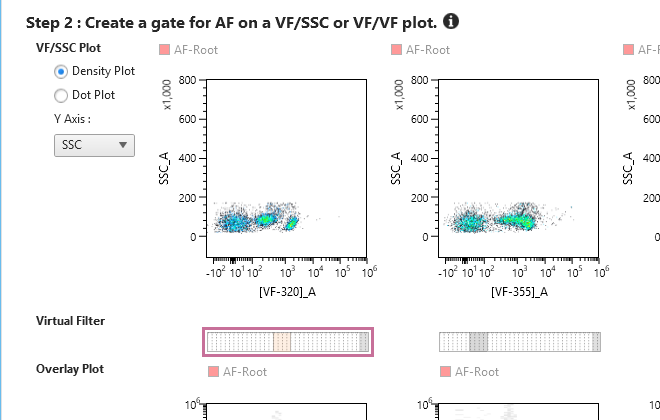
- In [Step 2], search for the autofluorescence population while changing the virtual filter ranges.
You can change the wavelength band of the virtual filters to any range using the mouse.
If you want to change the Y-axis of the plot to the wavelength range selected by the virtual filter, select the virtual filter of the desired laser axis from [Y Axis].
Hint
- You can adjust the axis settings on a plot (maximum value, minimum value, Biexponential axis parameter) by dragging the axis on the plot. The axis type is fixed to the type set before displaying the [Autofluorescence Finder] dialog.
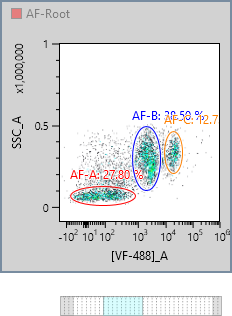
- Add a gate for the population to register as the autofluorescence population.
Hint
- Up to eight autofluorescence components can be registered as fluorochromes named “AF color 1” up to “AF color 8.”
- Click [OK].
Note
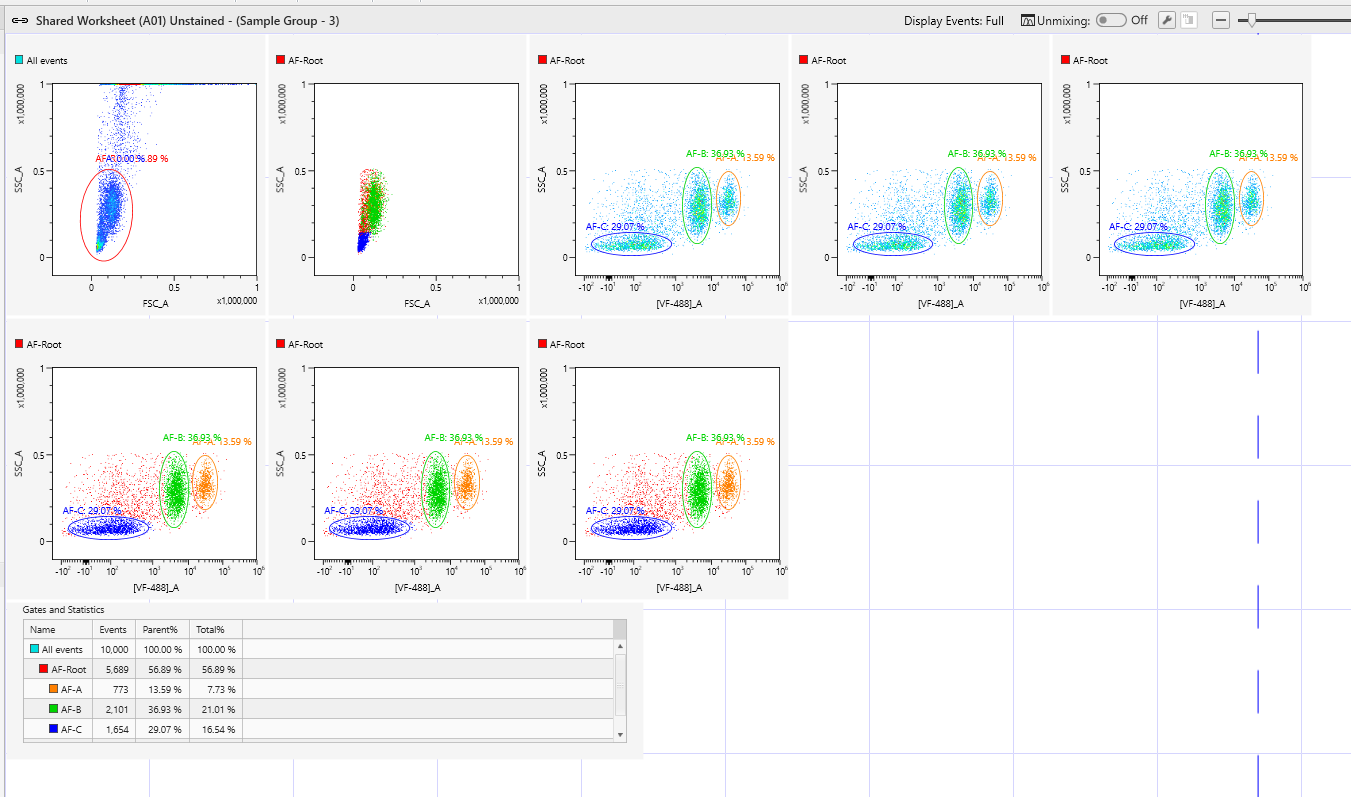
- The gate created in the [Autofluorescence Finder] dialog and its corresponding plot are added to the worksheet. Gates previously created in the Autofluorescence Finder are also updated.
A confirmation message appears.
- Click [OK].
A reconfirmation message appears.
- Click [Apply].
The worksheet is updated.
- Check the calculated spectral reference in the [Unmixing Settings] dialog.