Dimensionality Reduction Function
Dimensionality reduction is a function to “compress” multi-dimensional cell data to display it on a two-dimensional plot by converting to low-dimensional data while preserving as much of the important information about the multi-dimensional data structure as possible.
The Spectral Flow Analysis software employs two techniques: “UMAP” and “FIt-SNE.” UMAP tends to be better at preserving relationships among overall populations, while FIt-SNE tends to be better at isolating rare populations.
- For details about the operation, see “Analyzing by Learning Samples” in “Analysis Using the Dimensionality Reduction Function.”
The following is an example.
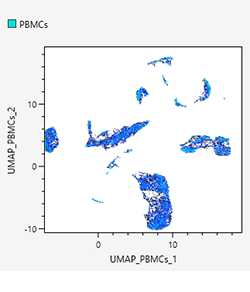
Density plots
Density plots display cell populations as densities.
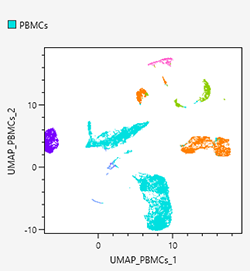
Dot plots
Dot plots allow displaying specific gated cell populations with different coloring by backgating. In addition, intuitive backgating can be achieved on dot plots by clicking to select the meta-clusters generated by BL-FlowSOM.
UMAP
Uniform manifold approximation and projection (UMAP) is a technique whereby the points that are close to an original feature space are compressed again after they have been compressed so as to make them closer. For details on the algorithms, see the following paper. With UMAP, you can select a density plot and dot plot.
L. McInnes, J. Healy, J. Melville, “UMAP: uniform manifold approximation and projection for dimension reduction,” arXiv preprint arXiv: 1802.03426, 2018.
E. Becht, L. McInnes, et al. “Dimensionality reduction for visualizing single-cell data using UMAP,” Nat. Biotechnol. 37, 38–40, 2019.
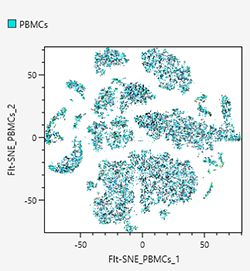
FIt-SNE
FFT-accelerated interpolation-based t-SNE (FIt-SNE) compresses the points that are close to an original feature space again after they have been compressed so as to make them closer just like with UMAP, but the “closeness” is represented by probability distribution. FIt-SNE is a technique to speed up t-Stochastic Neighborhood Embedding (t-SNE) by using FFT and other means. For details on the algorithms, see the following paper.
G. C. Linderman, M. Rachh, et al. “Fast interpolation-based t-SNE for improved visualization of single-cell RNA-seq data,” Nature Methods 16, 243-245, 2019.
L. van der Maaten, G. Hinton, “Visualizing data using t-SNE,” J. Mach. Learn. Res. 9, 2008.