[Statistics Editor] Dialog
The [Statistics Editor] dialog is used to add statistics to the statistics table.
The [Statistics Editor] dialog is displayed by clicking [Edit] of [Statistics] on the [Worksheet Tools] tab of the ribbon.
- For details about the operation, see “Customizing the Statistics Table.”
-
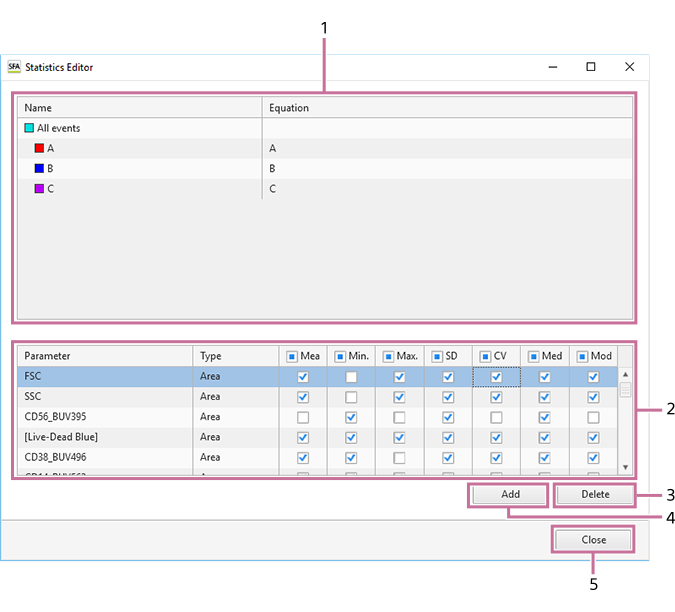
Gate list
Displays the hierarchy of gates added to the displayed sample tube. The top level in the hierarchy is represented by [All Events] (ungated parent population).
-
Statistics list
Displays the statistics values for the selected gate in the gate list. Place check marks in the checkboxes for the statistics you want to add to the statistics table.
You can select the following statistics.
- [Mean]: Mean value in the gated population. The mean value can also be used as a guide when adjusting the fluorescence unmixing spillover matrix manually.
- [Min.]: Minimum value in the gated population.
- [Max.]: Maximum value in the gated population.
- [SD]: Standard deviation of events from the mean value of the gated population.
- [CV]: Coefficient of variation of the distribution in the gated population.
- [Median]: Median value in the gated population. The median value can also be used as a guide when adjusting the fluorescence unmixing spillover matrix manually if there are a large number of outlying events (rare points).
- [Mode]: Mode value in the gated population. Corresponds to the highest peak on a histogram plot.
-
[Delete]
Deletes the pulse parameter selected in the statistics list.
-
[Add]
Adds pulse parameters to the statistics list. A new parameter configuration item is added to the bottom with each click. Select [Parameter] and [Type], and select the parameters to display.
-
[Close]
Closes the dialog.