[Gate Manager] Dialog
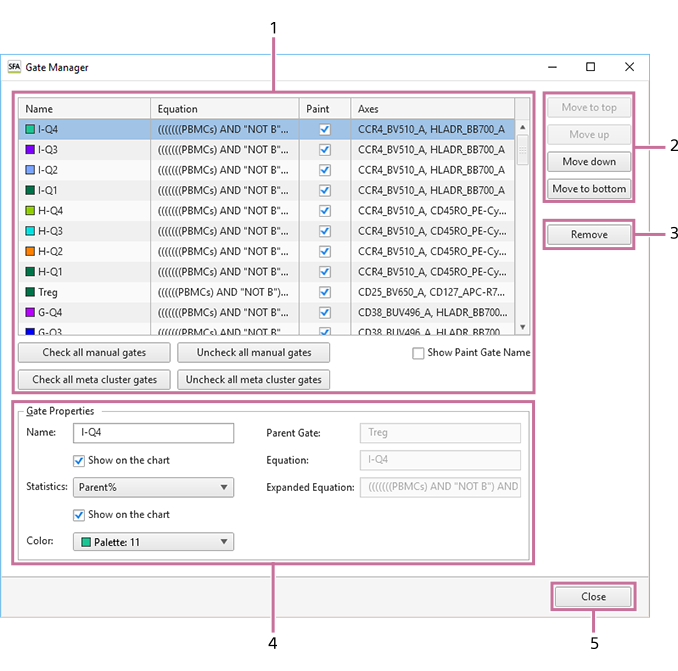
The [Gate Manager] dialog is used to manage and configure the gates set for the selected sample tube.
The [Gate Manager] dialog is displayed by clicking [Gate Manager] in [Gates] on the [Worksheet Tools] tab or in [Edit] on the [Gate Tools] tab.
-
Gate list
Displays a list of gates added to the selected sample tube.
The following information is displayed for each gate.
- [Name]: Displays the name of the gate.
- [Equation]: Displays the equation of the gate.
- [Paint]: Place check marks in the checkboxes of the gates for which to add colors on dot plots and histogram plots.
- [Axes]: Displays the X and Y axes of the plot.
[Check all manual gates]
Places check marks in the checkboxes of all manually set gates.
[Uncheck all manual gates]
Clears the check marks from the checkboxes of all manually set gates.
[Check all meta cluster gates]
Places check marks in the checkboxes of all meta cluster gates.
[Uncheck all meta cluster gates]
Clears the check marks from the checkboxes of all metal cluster gates.
[Show Paint Gate Name]
Displays the names of gates with check marks in [Paint] on dot plots and histogram plots.
-
Change order
Changes the order of the gate selected in the list. The order is used to change the coloring of events for each gate on dot plots.
[Move to top]
Moves the gate to the top.
[Move up]
Moves the gate up one row each time the button is clicked.
[Move down]
Moves the gate down one row each time the button is clicked.
[Move to bottom]
Moves the gate to the bottom.
-
[Remove]
Removes the gate selected in the list.
-
[Gate Properties]
Displays information about the gate selected in the list.
[Name]
Displays the name of the gate. You can edit the information, as required.
[Statistics]
Displays the statistics parameter configured for the gate. You can edit the information, as required.
- [Total%]: Proportion of events in the gated population as a percentage of the total number of events ([All Events]).
- [Parent%]: Proportion of events in the gated population as a percentage of the number of events in the parent population.
- [Events]: Number of events in the gated population.
[Color]
Displays the color of the gate. You can edit the information, as required.
[Parent Gate]
Displays the parent gate.
[Equation]
Displays the equation of the gate.
[Expanded Equation]
Displays the equation in the format (Parent gate) AND Equation. Note that this item is omitted if the parent gate is “All Events.”
-
[Close]
Closes the dialog.