Viewing Analysis Results
View the analysis results for the data of the ID7000 Spectral Cell Analyzer on the [View] tab.
Note
- You can only view analysis results on the [View] tab. To further analyze data, you need to switch to the [Analysis] tab. For the operating procedure, see “Opening the [Analysis] Tab.”
To display data for analysis
Search for the target data in the [Experiment Explorer] pane on the left side of the [View] tab, then select the well you want to analyze.
Main functions of the [View] tab
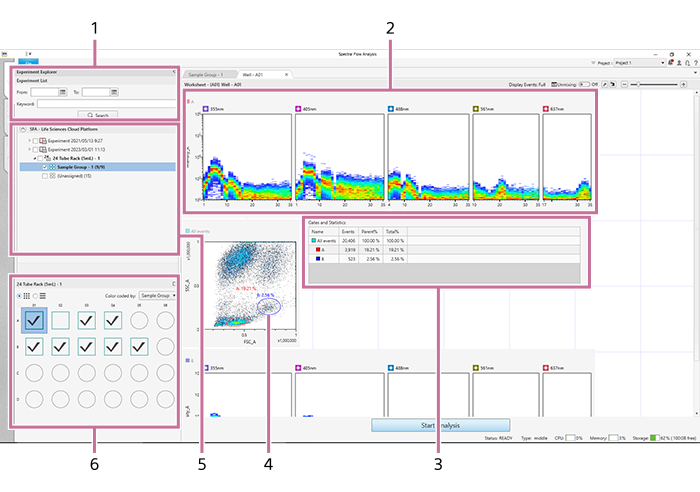
-
[Experiment Explorer] pane
Selects data to analyze. You can also search experiments by date and keyword.
-
Plots
Displays the data of analysis results.
A plot that lists the spectra of each laser is called a “ribbon plot.”
-
Statistics table
Displays statistics calculated automatically from acquired data.
-
Gates
Configures settings to group events with common characteristics, isolating them from all other events.
-
[Experiment] panel
Displays the structure of the experiment.
-
[Plate] panel
Displays a list of wells. You can switch the display to list view or map view.
The icon of a well/tube varies depending on the worksheet mode.
 : [Shared] mode
 : [Individual] mode