Checking Fluorochrome Unmixing Results Summary
You can check the results of fluorescence unmixing by displaying a list of plots for each fluorochrome combination.
You can also make manual adjustments to spectral unmixing as required.
- Display the worksheet for the well/tube whose spectral unmixing result you want to check.
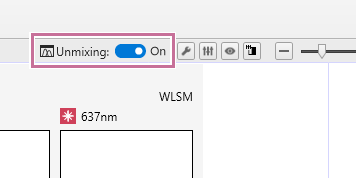
- Turn [Unmixing] on at the top right of the worksheet.
- Click [Unmixing Viewer] in the [Spectral Reference] group on the [Unmixing] tab of the ribbon.
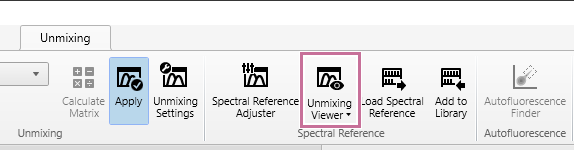
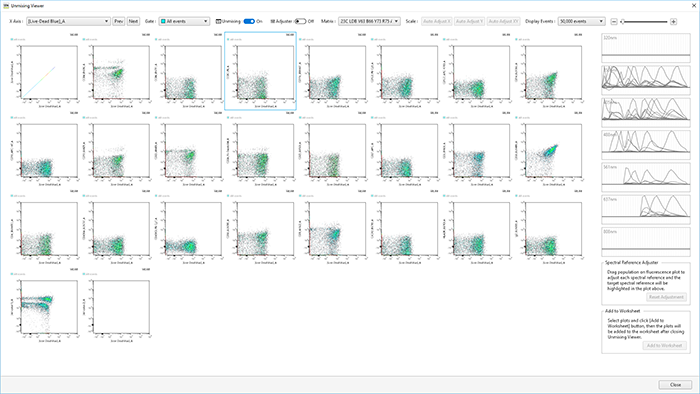
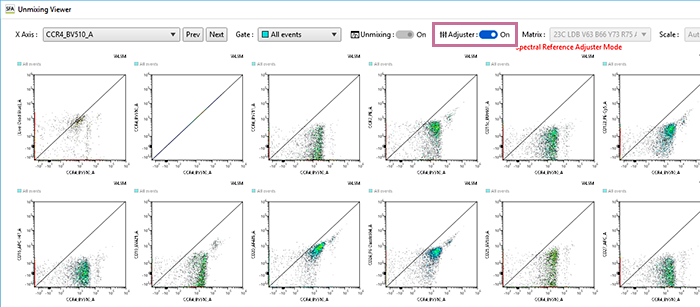
The Unmixing Viewer launches.
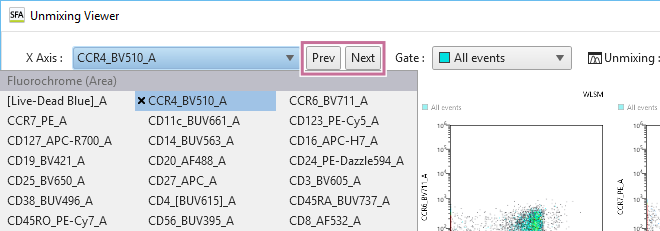
- Select a fluorochrome for the X axis in [X Axis].
You can also select the previous or next fluorochrome using [Prev] and [Next], respectively.
- Adjust the spectral unmixing as required.
- Turn [Adjuster] on at the top of the window.
The mode becomes spectral reference adjustment mode, and a diagonal line is displayed on plots.
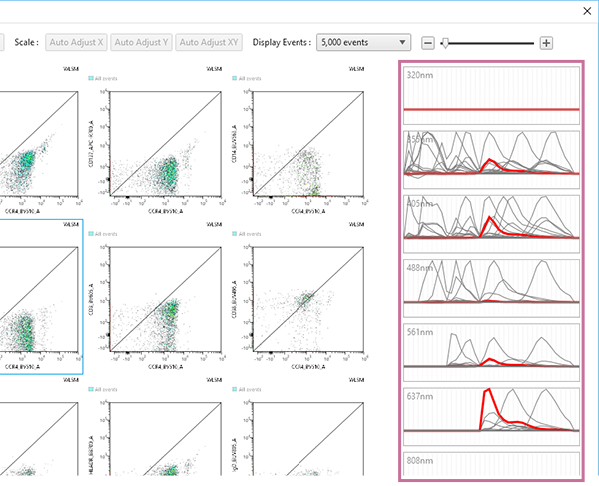
- Place the mouse cursor over a plot, and drag the plot to change the unmixing for the target parameter.
The mouse cursor changes to a horizontal double-ended arrow cursor in the left half of the plot, and a vertical cursor in the right half of the plot.
Dragging the mouse on the plot that you want to adjust will modify the spectral reference, changing the calculated results. The target spectrum to modify is displayed highlighted in the spectrum display area.
- Turn [Adjuster] on at the top of the window.
- When adjustment is finished, click
 of [Adjuster] at the top of the window.
A message appears to confirm whether to save the adjusted unmixing matrix.
- Click [Save] to save the matrix, or [Discard] to not save it.
When you click [Save], the [Save unmixing matrix] dialog appears. Follow the on-screen instructions to enter the matrix name and save the matrix.
- Turn [Adjuster] off at the top of the window to exit spectral reference adjustment mode.
If you clicked [Discard] in step 7, [Adjuster] is turned off.
- If there is a plot you want to add to the worksheet, select the plot and click [Add to Worksheet] at the bottom right of the window.
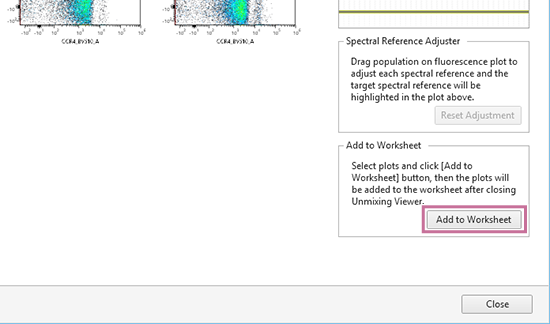
A confirmation dialog appears.
Clicking [OK] closes the Unmixing Viewer and then adds the plot to the worksheet.
- Click [Close] to exit the Unmixing Viewer.
Hint
- Changing the spectral unmixing on a plot will also change the unmixing on other plots having the same fluorochrome as one of its parameters, changing the position of events. The Unmixing Viewer displays plots of all fluorochrome combinations, so check the plot display for the corrected fluorochrome axis.