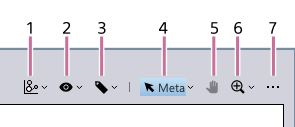
Toolbar
The toolbar for MST plots has the following menus.
-
 menu
menu Selects the cluster mode.
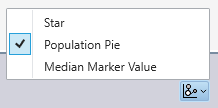
[Star]
Visualizes the expression levels of multiple markers.
[Population Pie]
Visualizes the proportions of cell populations.
[Median Marker Value]
Visualizes the expression level of the marker of one type.
-
 menu
menu Configures settings and performs operations related to meta clusters.
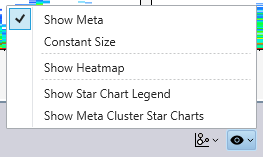
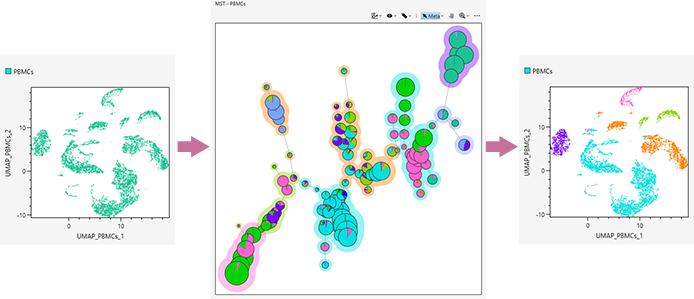
[Show Meta]
Displays the meta clusters.
[Constant Size]
Displays the circles of meta clusters at a constant size. The circle size can be changed in the properties of the MST plot.
[Show Heatmap]
Displays a heatmap of the selected meta cluster or cluster. You can change the color map, and output the median values displayed on the heatmap as a CSV-format file.
- For details about the operation, see “Displaying the Heatmap.”
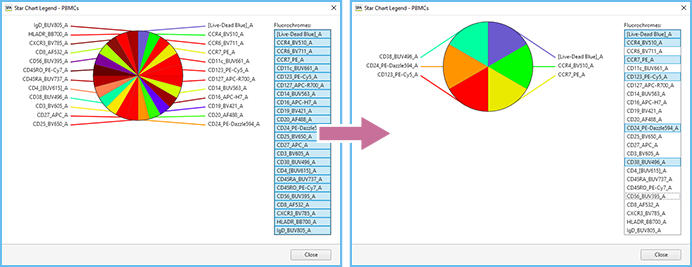
[Show Star Chart Legend]
Selects the markers to display when star chart.
[Show Meta Cluster Star Chart]
Displays a star chart on a meta cluster basis when star chart.
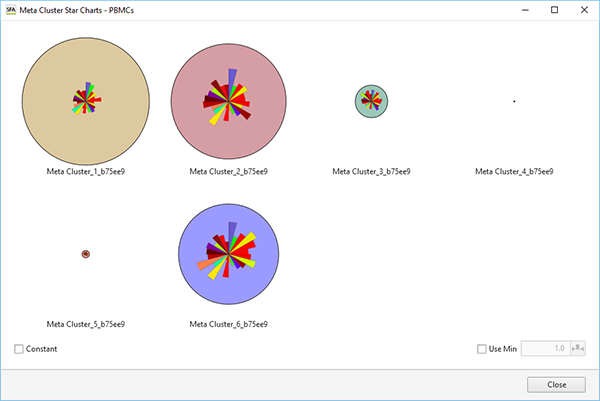
[Constant]: Place a check mark here to display the circles of meta clusters at a constant size.
[Use Min]: Place a check mark here to set the minimum size for displaying the circles of meta clusters.
-
 menu
menu Edits meta clusters.
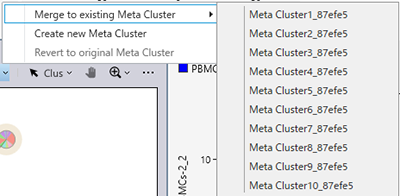
[Merge to existing Meta Cluster]
Merges the selected meta cluster with another meta cluster.
[Create new Meta Cluster]
Creates a new meta cluster.
[Revert to original Meta Cluster]
Returns the meta cluster to the state immediately after running BL-FlowSOM.
-
[Cluster]/[Meta Cluster]
Switches between meta cluster selection mode and cluster selection mode. Make sure you switch the mode before operating meta clusters or clusters.
[Cluster]
Cluster selection mode
[Meta Cluster]
Meta cluster selection mode
-
 menu
menu Allows moving the display area by dragging when an MST plot is displayed zoomed in.
-
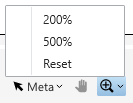
 menu
menu Displays the plot zoomed in to 200% or 500%. If you select [Reset], the plot returns to its original size.
-
[…] menu
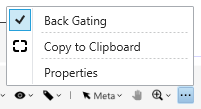
[Back Gating]
If [Back Gating] is turned on and the mode is switched to [Back Gating], the [Paint] fields in the [Gate Manager] dialog turn on for a metacluster selected on the MST plot, and the events in that metacluster are displayed in color on the dot plot.
[Copy to Clipboard]
Copies this plot to the clipboard so that it can be pasted in other software for use in a report or other content.
[Export Picture]
Exports this plot as a PNG-format image. Clicking this button displays the [Export Plot Images] dialog.
[Properties]
Displays the properties for this plot. You can change each item, as required.
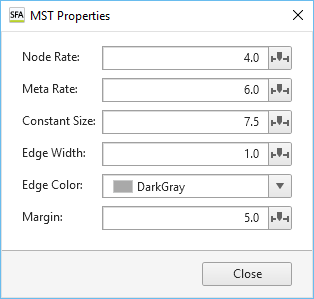
[Node Rate]: Changes the display size of cluster circles.
[Meta Rate]: Changes the display size of the fill color of meta clusters.
[Constant Size]: Changes the size of the circles of meta clusters for when [Constant Size] is selected in the menu.
[Edge Width]: Changes the width of an edge.
[Edge Color]: Changes the color of an edge.
[Margin]: Changes the margin between a plot frame and graph.