[Gate Properties] Dialog
The [Gate Properties] dialog displays information about the selected plot. You can change the setting of each parameter, as required.
The [Gate Properties] dialog is displayed by clicking of [Edit] on the [Gate Tools] tab of the ribbon or right-clicking a gate and selecting [Properties].
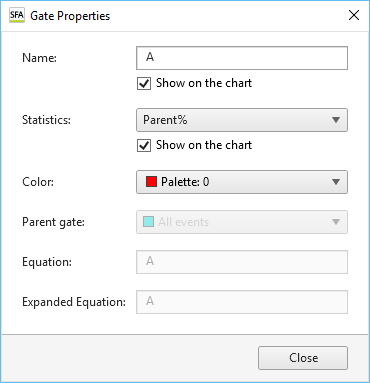
[Name]
Displays the name of the gate.
Place a check mark in [Show on the chart] to display the name of the gate on the plot.
[Statistics]
Selects the statistics parameter configured for the gate.
Place a check mark in [Show on the chart] to display the statistics parameter on the plot.
- [Total%]: Proportion of events in the gated population as a percentage of the total number of events ([All Events]).
- [Parent%]: Proportion of events in the gated population as a percentage of the number of events in the parent population.
- [Events]: Number of events in the gated population.
[Color]
Selects the color of the gate.
[Parent Gate]
Displays the parent gate.
[Equation]
Displays the equation of the gate. This parameter cannot be modified.
[Expanded Equation]
Displays the equation in the format (Parent gate) AND Equation. Note that this item is omitted if the parent gate is “All Events.” This parameter cannot be modified.
[Close]
Closes the dialog.