Creating a Spectral Reference
A spectral reference provides information about the shape of the fluorescence spectrum, which is used for fluorescence unmixing. A spectral reference can be created from the acquisition data of a single stain control.
- Import an acquisition data of a single stain control.
Note
- A positive control (PC) and a negative control (NC) acquired under the same acquisition conditions are required.
- The positive and negative controls differ only in the presence/absence of staining. Basically, the same type of particles must be used. For example, if a single stain beads control is prepared as the positive control, import a control using the same type of beads, unstained, for the negative control.
- Open the desired experiment, then select a sample to analyze.
Set Positive and Negative controls for each fluorochrome.
Set gates corresponding to the positive control and negative control populations, for the prepared single stain controls and unstained control, and assign them to the fluorochromes in the [Unmixing Settings] dialog.
Example:
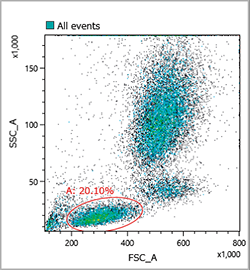
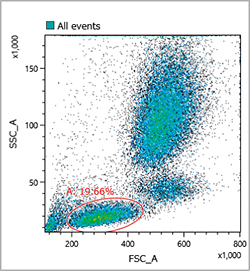
- Add a gate to the density plot for the FITC single stain control.
Display the FITC single stain control, click [Ellipse] in the [New Gate] group on the [Plot Tools] tab of the ribbon, and add the gate to the FSC-SSC density plot.
You can adjust the axis scale or zoom the plot, as required, if the gate is difficult to draw.
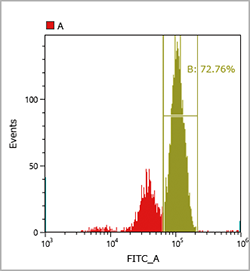
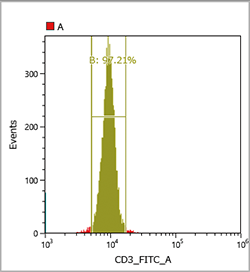
- Add a histogram plot and add a gate to the FITC positive population.
Right-click the gate added in step 1, and select [Create a Child Plot] – [Histogram Plot] to add a histogram, and change the horizontal axis to FITC-A.
Select the histogram plot, click [Linear] in the [New Gate] group on the [Plot Tools] tab of the ribbon, and add a linear gate to the FITC positive population.
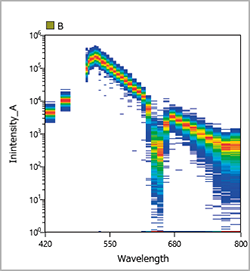
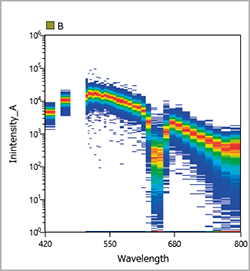
You can display a spectrum chart by right-clicking the gate for the FITC positive population and selecting [Create a Child Plot] – [Spectrum Plot] to check that the gate is set appropriately.
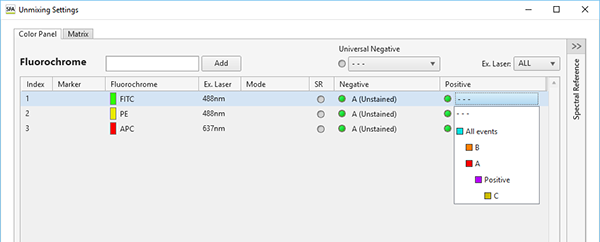
- Click [Unmixing Settings] in the [Unmixing] group on the [Unmixing] tab of the ribbon.
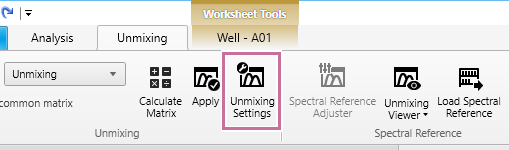
The [Unmixing Settings] dialog appears.
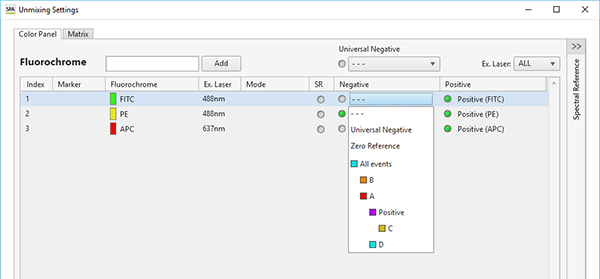
- Assign the configured gate to the FITC positive control.
Click [Positive] for FITC in the fluorochrome list, and select the gate set for the FITC positive population from the displayed list.
- Set the gate for the unstained control corresponding to the FITC positive population above.
Repeat steps 1 to 3 for the unstained control.
First, set a gate for the data for the unstained control.
Next, add a histogram plot.
Display a spectrum plot to check that the gate is set appropriately.
The populations specified for Positive and Negative must basically be the same type of cells. Accordingly, on the FSC-SSC plot, the gate should be set in roughly the same position as the gate for the FITC positive population. If not set correctly, the correct spectral reference will not be obtained due to the effects of autofluorescence of cells.
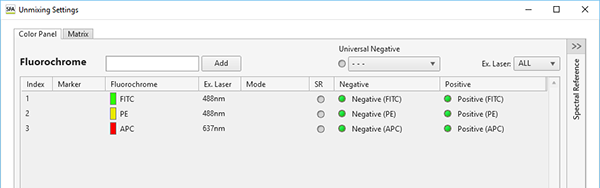
- Assign the configured gate to the FITC Negative control.
- Assign the gates for Positive and Negative controls for all fluorochromes in the same way.
When assigning an unstained sample that is common to multiple fluorochromes, you can assign a gate to Universal Negative and then set the Negative of each fluorochrome to Universal Negative to eliminate the need for individual Negative gate settings.
- Add a gate to the density plot for the FITC single stain control.
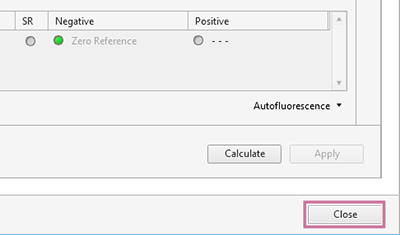
- Click [Calculate].
The fluorescence unmixing is calculated.
If a data saturated warning appears
When calculating a spectral reference, the percentage of event data that was saturated at the time of acquisition in the gates set to the positive gate and negative gate is evaluated, and a warning is displayed if it is determined that the quality will be affected. If you want to exclude saturated event data from the spectral reference calculation, place a check mark in [Calculate Spectral Reference without saturated event(s)], and click [Continue].
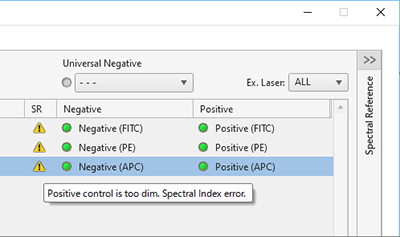
If a caution mark appears in the [Unmixing] panel
The quality of each spectral reference is evaluated when it is calculated. If a spectral reference conflicts with the following conditions, the quality is deemed to be bad, and the caution mark appears for the corresponding fluorochrome in the [Unmixing] panel.
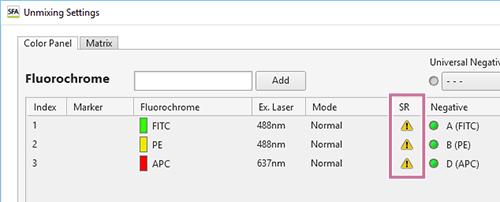
The reason can be displayed by hovering the mouse over the caution mark.
-
Spectral index error
The caution mark appears if the spectral index value derived from the Area/Height parameters of the data used to calculate the spectral reference is less than 5.
-
Negative value error
The caution mark appears if the negative value in the calculated spectral reference is higher than 10% of the maximum positive value.

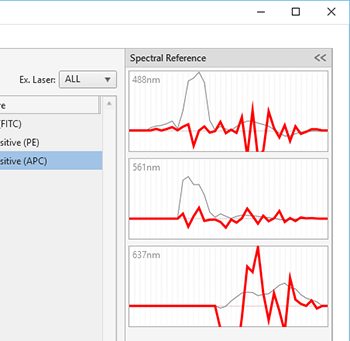
If a conflict occurs, the following types of waveforms are displayed.
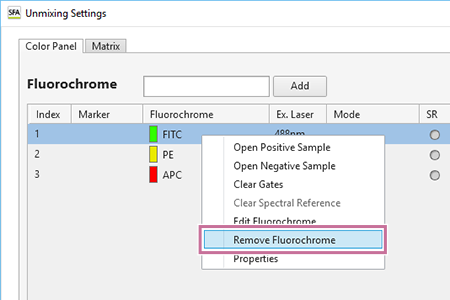
To remove a fluorochrome from the list
Right-click the target cell, and select [Remove Fluorochrome].
When the confirmation message appears, click [Yes].