Analyzing by Learning Samples
BL-FlowSOM is a clustering function to extract a cell population automatically by applying the technology of machine learning.
Set the learning conditions, and analyze by learning samples. With BL-FlowSOM, you can select the star, population pie, and median marker value graph modes.
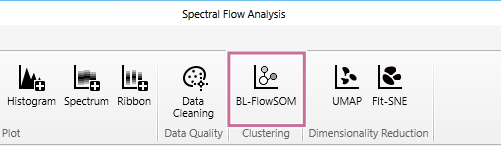
- Select the gates to be analyzed, then click [BL-FlowSOM] in [Clustering] on the [Gate] tab of the ribbon.
The [BL-FlowSOM] dialog appears.
- Set each item.
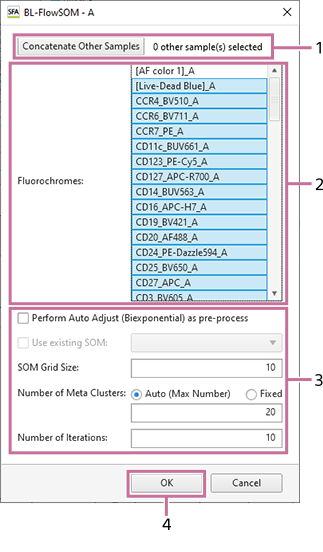
- Select the samples to concatenate when analyzing by concatenating samples.
For details about the operation, see “Analyzing by Concatenating Multiple Samples (when BL-FlowSOM).”
- Select the fluorochromes to use as inputs.
- Configure the learning parameters.
- Click [OK].
- For details about each item, see “[BL-FlowSOM] Dialog.”
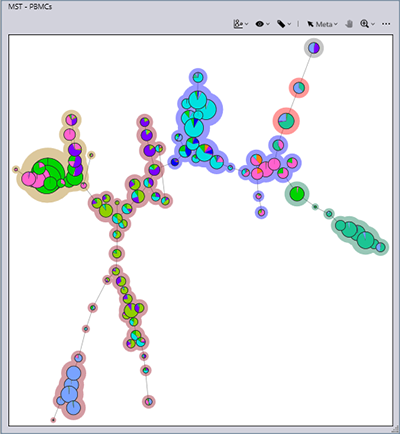
An empty plot appears, and a busy icon is displayed at the top right during learning. When leaning finishes, an MST plot is displayed.
- Select the samples to concatenate when analyzing by concatenating samples.
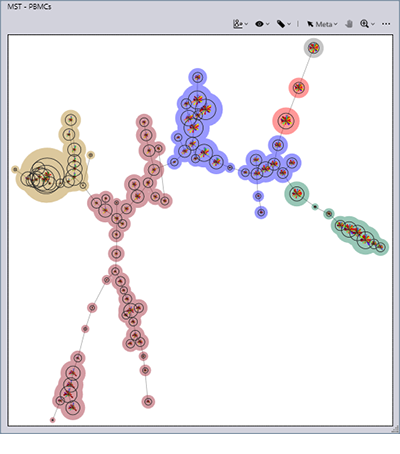
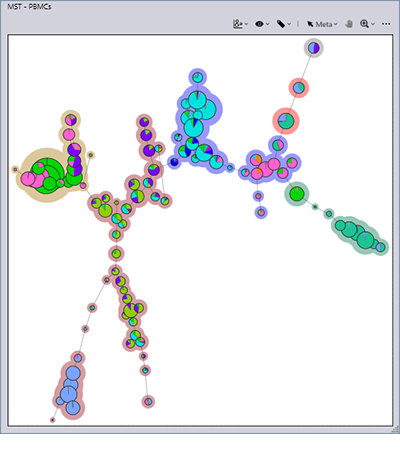
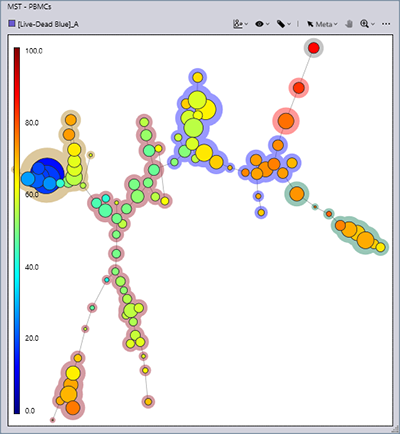
- Select the graph mode.
Right-click within the plot, and select the graph mode from [Graph Mode] in the context menu.
You can also select the graph mode in the
 menu at the top right of the MST plot.
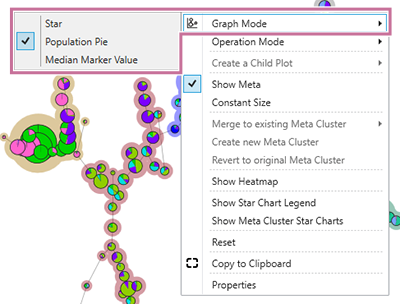
[Star]: Visualizes the expression levels of multiple markers.
[Population Pie]: Visualizes the proportions of cell populations.
[Median Marker Value]: Visualizes the expression level of the marker of one type.
- Analyze using the various tools.
- For details about the various tools, see “Tool Menu Overview.”