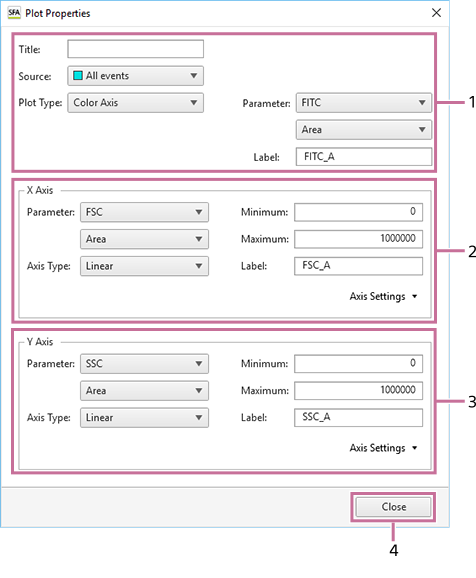
[Plot Properties] Dialog (Properties for Color Axis Plots)
The [Plot Properties] dialog displays information about the selected plot. You can change the setting of each parameter, as required.
The [Plot Properties] dialog is displayed by clicking  of [Edit] or right-clicking a plot and selecting [Properties].
-
Basic information
Displays the following information. You can change the settings, as required.
[Title]
Title of the plot.
[Source]
Population of the plot (parent gate).
[Plot Type]
Type of plot.
[Parameter]
Parameter.
[Label]
Axis label displayed on the graph.
[Show color bar on the plot]
Place a check mark here to display a color bar to show a legend on the color axis plot.
-
[X Axis]
Displays information about the X axis of the plot. You can change the settings, as required.
[Parameter]
Parameter.
[Axis Type]
Type of axis.
- Linear: Performs a linear transformation between the acquisition values and the channel numbers (bins) used to acquire data (0 to 256). Linear scales are typically used to display forward scatter and back scatter parameters on plots.
- Log: Display cells that exhibit fluorescence with intensities across a wide dynamic range. Log scales help to make individual peaks easier to visualize. However, log scales cannot adequately represent data with a low mean and high variance.
- Bi-exponential: Combination of a linear scale at the lower end of the axis (around zero) and a logarithmic scale at the higher end of the axis, with an algorithmic transition between the two scales. A biexponential scale allows events close to or below zero to be plotted.
[Minimum]
Minimum value of the scale.
[Maximum]
Maximum value of the scale.
[Label]
Axis label displayed on the graph.
[Options]
- [Negative Area]: Sets negative area.
- [Extra Negative Area]: Sets extra negative area.
[Axis Settings]
Clicking [Save as Preference Settings] saves the current state as preference settings.
-
[Y Axis]
Displays information about the Y axis of the plot.
For details about each item, see [X Axis].
-
[Close]
Closes the dialog.