Adding Plots
You can add plots to the worksheet.
- Click the type of plot to add in the [New Plot] group on the [Worksheet Tools] tab of the ribbon.
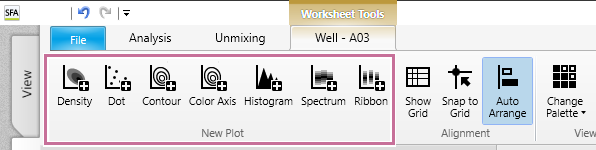
A plot is added to the worksheet. The new plot created represents the [All Events] population.
- Change the layout of plots, as required.
You can change the position of plots by dragging the title part of target plot and dropping it to a new location.
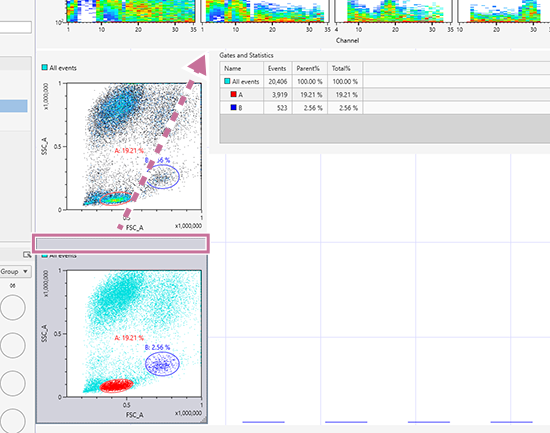
You can also zoom in/out to change the display size of plots individually by dragging the bottom right of the plot.