[Plot Tools] Tab (Ribbon)
The [Plot Tools] tab of the ribbon has the following buttons.
- For details about the operating procedure, see “Adding Plots.”
-
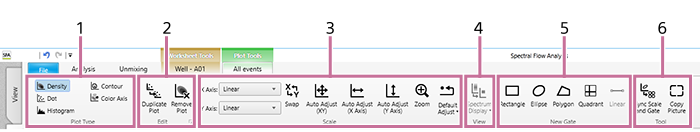
[Plot Type]
These buttons are used to change the plot type.
This item can be applied to multiple selected plots on the worksheet.
[Density]/[Dot]/[Histogram]/[Contour]/[Color Axis]
Changes the type of the selected plot.
Hint
- Spectrum plots cannot be modified.
-
[Edit]
These buttons are used to duplicate and delete plots.
[Duplicate Plot]
Duplicates the selected plot or statistics table within the worksheet.
[Remove Plot]
Removes the selected plot.

Displays the properties for the selected plot. You can change the setting of each parameter, as required. Clicking this button displays the [Plot Properties] dialog.
- For dot plots, density plots, and histogram plots, see “[Plot Properties] Dialog (Properties for Dot Plots, Density Plots, and Histogram Plots)”.
- For contour plots, see “[Plot Properties] Dialog (Properties for Contour Plots)”.
- For color axis plots, see “[Plot Properties] Dialog (Properties for Color Axis Plots)”.
- For spectrum plots, see “[Plot Properties] Dialog (Properties for Spectrum Plots)”.
-
[Scale]
These buttons are used to make settings related to the scale of the X and Y axes.
This item can be applied to multiple selected plots on the worksheet.
[X Axis]/[Y Axis]
Selects the type for the X and Y axes.
- For details about the items, see “[Plot Properties] Dialog (Properties for Dot Plots, Density Plots, and Histogram Plots).”
[Swap]
Swaps the X axis and Y axis parameters.
[Auto Adjustment (XY)]
Automatically adjusts the scale of the X axis and Y axis.
[Auto Adjustment (X Axis)]
Automatically adjusts the scale of the X axis.
[Auto Adjustment (Y Axis)]
Automatically adjusts the scale of the Y axis.
[Zoom]
Changes the magnification of plots. Click this button to turn on zoom, and then drag around the portion of the plot you want to zoom in on to magnify that portion.
[Default Adjust]
Restores the scales to their default display.
Hint
- Automatically adjusting the axis scale places the minimum and maximum values of the population near the ends of the X axis and Y axis.
- The automatic adjustment function adjusts the axis when the button is clicked. During data acquisition, events that are detected after the axes are automatically adjusted may be off-scale. In this case, readjust the axes as required.
-
[View]
These buttons are used to make settings related to the display of plots.
[Spectrum Display]
Sets the spectrum display mode.
- [Display All]: Displays all events.
- [Display High Density]: Displays the high-incidence spectral information, omitting low-incidence events, to make the display easier to view.
-
[New Gate]
These buttons are used to add a new gate.
- For details about the procedure to add gates, see “Adding Gates.”
[Rectangle]
Adds a rectangle gate.
[Ellipse]
Adds an ellipse gate.
[Polygon]
Adds a polygon gate.
[Quadrant]
Adds a quadrant gate. Quadrant gates are added with the intersection point of the quadrants at the position of the mouse click.
[Linear]
Adds a linear gate to a histogram plot. Linear gates are added by dragging the mouse horizontally on the histogram plot. The height of the reference line is for display only, and has no effect on the value of the linear gate.
-
[Tool]
[Sync Scale and Gate]
Synchronizes the scale and gates of all plots within a sample group.
[Copy Picture]
Copies the selected plot or statistics table to the clipboard as an image so that it can be pasted in other software for use in a report or other content.
This item can be applied to multiple selected plots on the worksheet.
[Export Picture]
Exports the selected plot as a PNG-format image. Clicking this button displays the [Export Plot Images] dialog.
This item can be applied to multiple plots selected on the worksheet.