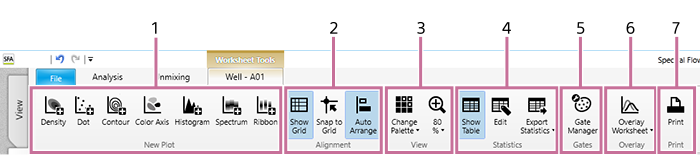
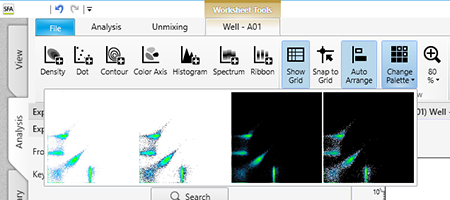
[Worksheet Tools] Tab (Ribbon)
The [Worksheet Tools] tab of the ribbon has the following buttons.
-
[New Plot]
These buttons are used to add a new plot.
- For details about adding plots, see “Adding Plots.”
[Density]
Adds a new density plot.
[Dot]
Adds a new dot plot.
[Contour]
Adds a new contour plot.
[Color Axis]
Adds a new color axis plot.
[Histogram]
Adds a new histogram plot.
[Spectrum]
Adds a new spectrum plot.
[Ribbon]
Adds a new ribbon plot.
-
[Alignment]
These buttons are used to display a grid on the worksheet and to align displayed items with the grid.
[Show Grid]
Displays a grid on the worksheet.
[Snap to Grid]
Aligns the plots and statistics table with the grid when they are moved.
[Auto Arrange]
Automatically aligns the positions of the plots and statistics table.
-
[View]
These buttons are used to make settings related to the display of plots.
[Change Palette]
Changes the display style of the selected plot.
Click this button and select the display style.
- White background
- White background with highlighted outlying (rare) events
- Black background
- Black background with highlighted outlying (rare) events
Highlighting outlying events is useful for identifying and analyzing rare events.
Zoom
Changes the display size of plots. The current zoom factor is displayed below the icon. This setting is applied to all plots. Click this button and select the zoom factor, or use the slider to set the zoom factor.
-
[Statistics]
These buttons are used to make settings related to the statistics table.
[Show Table]
Shows/hides the statistics table.
[Edit]
The statistics in the table can be customized. Clicking this button displays the [Statistics Editor] dialog. See “[Statistics Editor] Dialog”.
[Export Statistics]
Exports the contents of the statistics table as a file in CSV format.
-
[Gates]
This button is used to manage and configure gates.
- For details about adding gates, see “Editing Gates.”
[Gate Manager]
Allows you to manage and configure the gates set for the selected sample tube. Clicking this button displays the [Gate Manager] dialog. See “[Gate Manager] Dialog”.
-
[Overlay]
This button is used to display spectral data for the selected plots overlaid.
- For details about the operation, see “Displaying Multiple Spectral Data Overlaid.”
[Overlay Worksheet]
Displays the overlay worksheet.
- [Half Worksheet View]: Displays the overlay worksheet in the bottom half of the worksheet.
- [Full Worksheet View]: Displays the overlay worksheet occupying the full area of the worksheet.
- [Hide Overlay Worksheet]: Hides the overlay worksheet.
-
[Print]
This button is used to print the worksheet.
[Print]
Allows you to print the content displayed on the worksheet.
Clicking this button displays the [Print] window. See “[Print] Window”.