Statistics Table
The statistics table displays the following information.
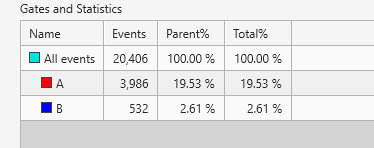
[Name]
Displays the names of gates and parameters.
[Events]
Displays the number of events.
[Parent%]
Displays the proportion of events of each gate relative to its parent.
[Total%]
Displays the proportion of events of each gate relative to the total of all events.
Gate hierarchy
Displays the hierarchical relationship between gates. The color to the left of the gate name shows the color of the gates on plots.
You can change the statistics items displayed for each gate in the statistics table.
- For details about the operation, see “Editing Items Displayed in the Statistics Table.”
 (Individual)
This icon indicates that a gate is handled as an individual gate in the case of a shared worksheet.