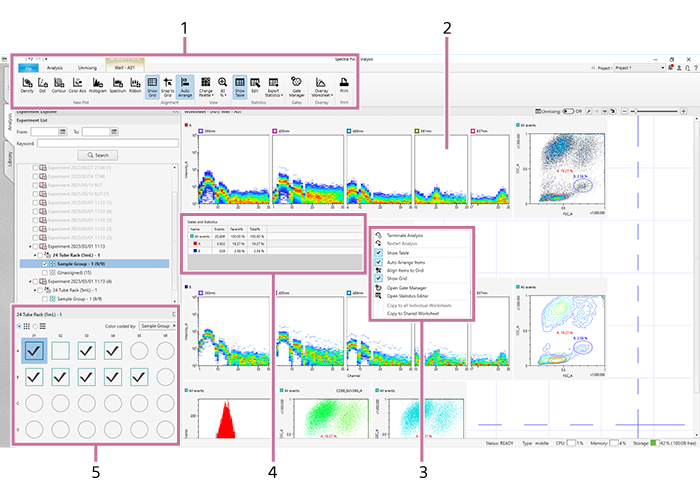
Structure of [Analysis] Tab
The [Analysis] tab is used to analyze the data in the imported experiment.
The [Analysis] tab has the following structure.
-
Tabs (ribbon)
The ribbon has the following tabs (tabs vary depending on the current selection).
- [Analysis] tab (See “[Analysis] Tab (Ribbon)”.)
- [Unmixing] tab (See “[Unmixing] Tab (Ribbon)”.)
- [Worksheet Tools] tab (See “[Worksheet Tools] Tab (Ribbon)”.)
- [Plot Tools] tab (See “[Plot Tools] Tab (Ribbon)”.)
- [Gate Tools] tab (See “[Gate Tools] Tab (Ribbon)”.)
-
Worksheet
This is the worksheet included in the data of the selected well/tube.
For details about the tools and information display that are common for worksheets, see “Toolbar” and “Status Bar.”
-
Context menu
For details about the menu items, see “Worksheet.”
-
Statistics Table
Displays statistics calculated automatically from acquired data.
For details about each item, see “Statistics Table.”
-
Control pane
Selects a sample for analysis.
For details about the operating procedure, see “Selecting a Sample for Analysis.”