[Preference Settings] Dialog ([Worksheet])
[Worksheet] in the [Preference Settings] dialog is used to specify the default settings related to worksheets.
The [Preference Settings] dialog is displayed by clicking [Information] – [Preference Settings] on the [File] tab.
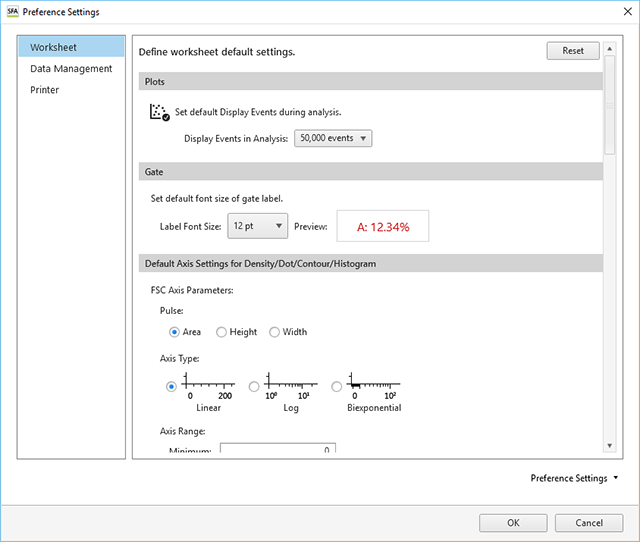
[Plots]
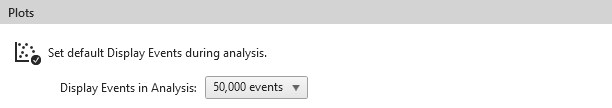
[Display Events in Analysis]
Selects the number of events to display on plots during analysis.
[Gate]
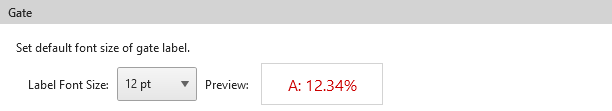
[Label Font Size]
Selects the font size of text labels shown on gates. You can check the size in [Preview].
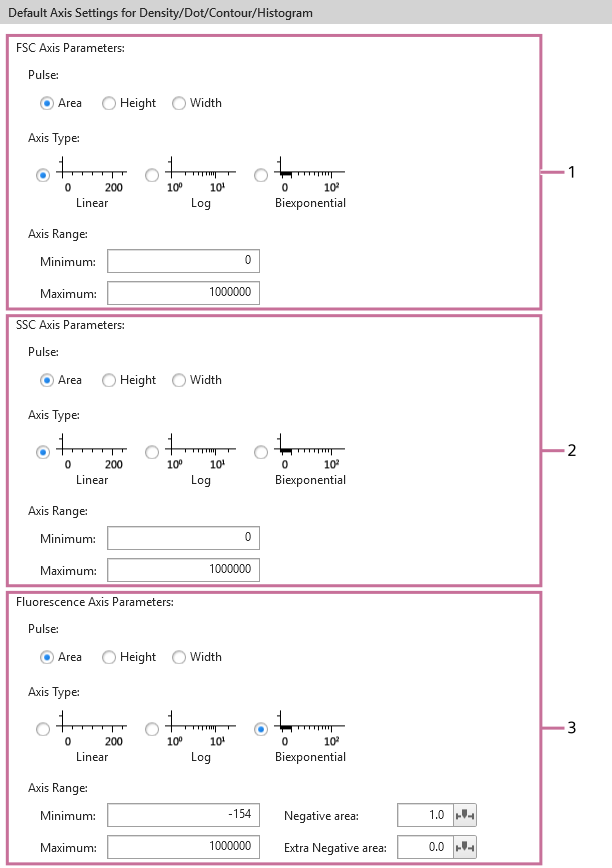
[Default Axis Settings for Density/Dot/Contour/Histogram]
Sets the default axis settings for density plots, dot plots, contour plots, and histogram plots.
-
[FSC Axis Parameters]
Sets the forward scatter (FSC) axis parameters.
- [Pulse]: Selects the pulse type.
- [Axis Type]: Selects the scale type of an axis.
- [Axis Range]: Sets the axis scale range by specifying the minimum value, negative area, or maximum value according to the axis scale type.
-
[SSC Axis Parameters]
Sets the side-scatter (SSC) axis parameters.
- [Pulse]: Selects the pulse type.
- [Axis Type]: Selects the scale type of an axis.
- [Axis Range]: Sets the axis scale range by specifying the minimum value, negative area, or maximum value according to the axis scale type.
-
[Fluorescence Axis Parameters]
Sets the fluorescence data axis parameters.
- [Pulse]: Selects the pulse type.
- [Axis Type]: Selects the scale type of an axis.
- [Axis Range]: Sets the axis scale range by specifying the minimum value, negative area, or maximum value according to the axis scale type.
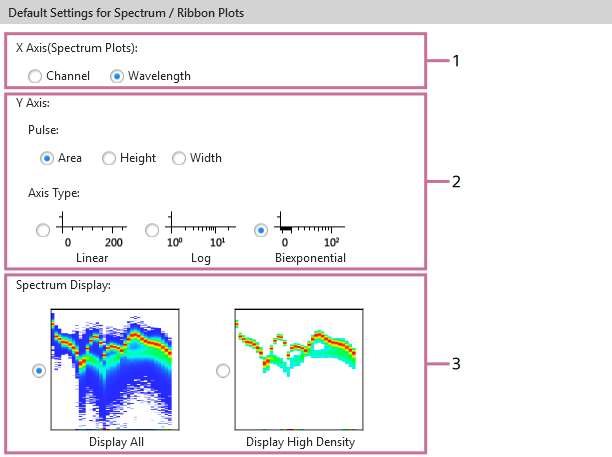
[Default Settings for Spectrum / Ribbon Plots]
Sets the default settings for spectrum plots and ribbon plots.
-
[X Axis (Spectrum Plots)]
Selects the X-axis parameter.
-
[Y Axis]
Selects the Y-axis pulse parameter and scale type.
-
[Spectrum Display]
Sets the spectrum display mode.
- [Display All]: Displays all density data.
- [Display High Density]: Displays the high-incidence spectral information, omitting low-incidence events, to make the display easier to view.
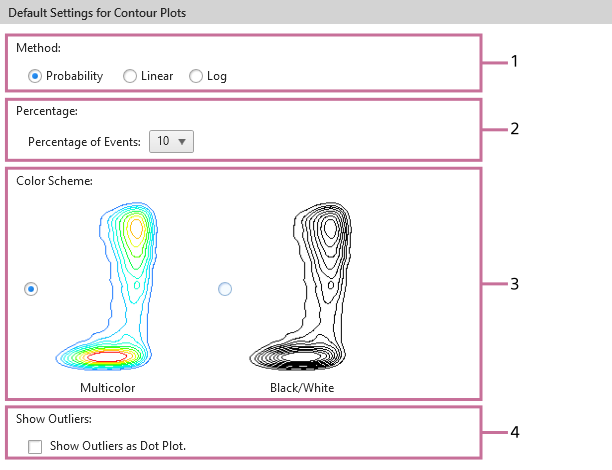
[Default Settings for Contour Plots]
Sets the default settings for contour plots.
-
[Method]
Selects the division method.
- [Probability]: Draw contour lines so that each area between contour lines contains the same number of events.
- [Linear]: Draw contour lines so that each area between contour lines contains the maximum density divided linearly.
- [Log]: Draw contour lines so that each area between contour lines contains the maximum density divided logarithmically.
-
[Percentage]
Selects the percentage division of the contour lines. The larger the number, the larger the distance between contour lines.
-
[Color Scheme]
Selects the color scheme.
- [Multicolor]: High-density contour lines are shown in red, and low-density contour lines are shown in blue.
- [Black/White]: Display in black and white.
-
[Show Outliers]
Place a check mark here to display outlier events outside the outermost contour lines as dots.