Displaying the Heatmap
You can change the type of color map, and output the median values (percentage indication) displayed on the heatmap as a CSV-format file.
To display the heatmap
- Select [Show Heatmap] from the
 menu on the toolbar.
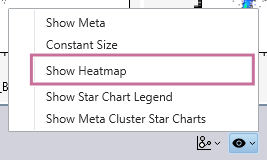
The heatmap is displayed.
To change the type of color map
Select the type of color map in [Color Map].
You can select the following color maps.
- Fluorochrome Color
- RdYlBu / 8
- YlGn / 9
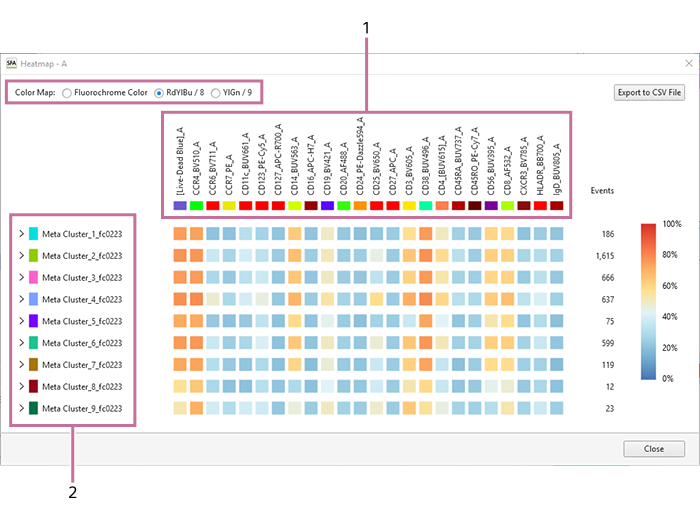
- Fluorochrome selected in the legend of a star chart
- Meta cluster selected in [Gate Manager] or an MST plot
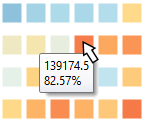
To check the expression percentage
If you hover the mouse cursor over a color square, you can check the expression percentage.
To display the heatmap of clusters
When the icon on the left of the metacluster name is clicked to expand the metacluster, the clusters are displayed.
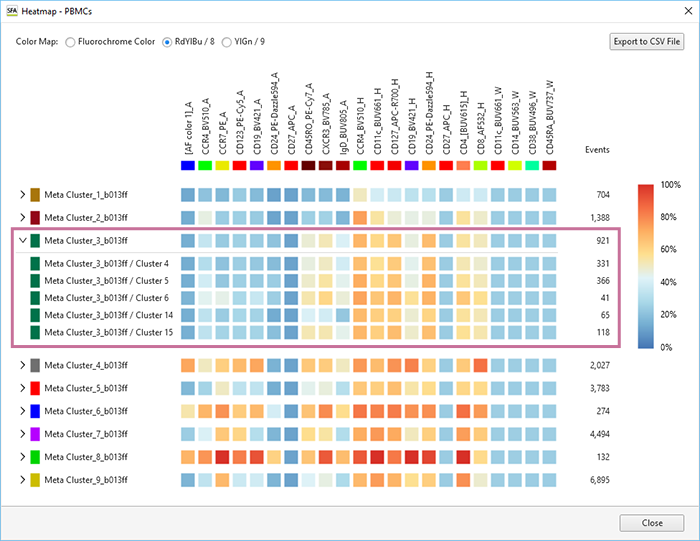
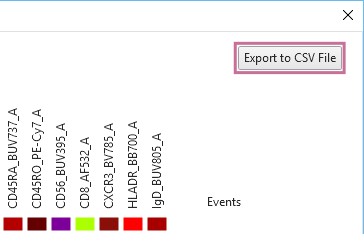
To output the heatmap as a CSV-format file
The median values displayed on the heatmap can be output as a CSV-format file.
Click [Export to CSV File], and specify the destination folder in the displayed dialog.