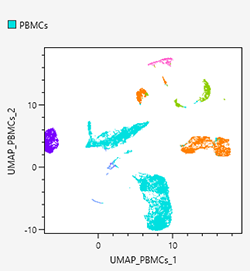
Coloring Cell Populations (Dot Plot)
With a dot plot, you can color specific cell populations (gates and meta clusters).
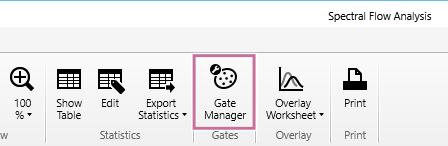
- Select [Gate Manager] in [Gates] on the [Worksheet Tools] tab of the ribbon.
You can also perform the same operation by right-clicking within the dot plot and selecting [Open Gate Manager] from the context menu.
The [Gate Manager] dialog appears.
- Color the cell populations.
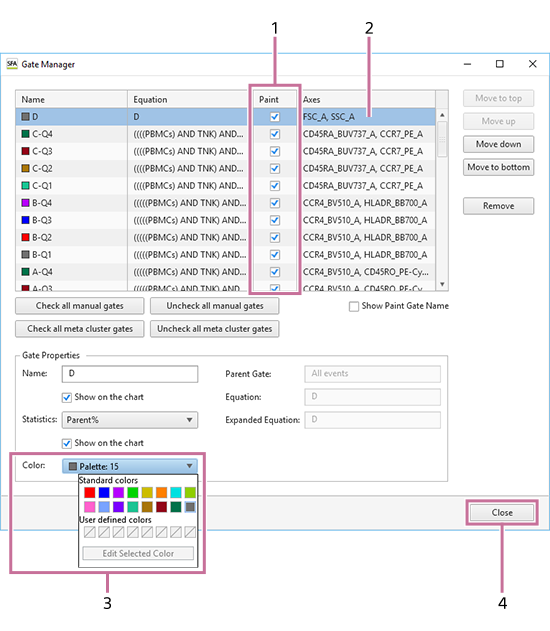
- In the [Paint] column, place check marks in the checkboxes for the populations you want to color.
You can operate all manual gates and meta cluster gates simultaneously by using [Check all manual gates], [Uncheck all manual gates], [Check all meta cluster gates], and [Uncheck all meta cluster gates].
- Select the population whose color you want to change.
You can use [Move to top], [Move up], [Move down], and [Move to bottom], as required, to change the order used when coloring.
- Change the color of the cell population in [Color].
- Click [Close] to close the dialog.
- In the [Paint] column, place check marks in the checkboxes for the populations you want to color.