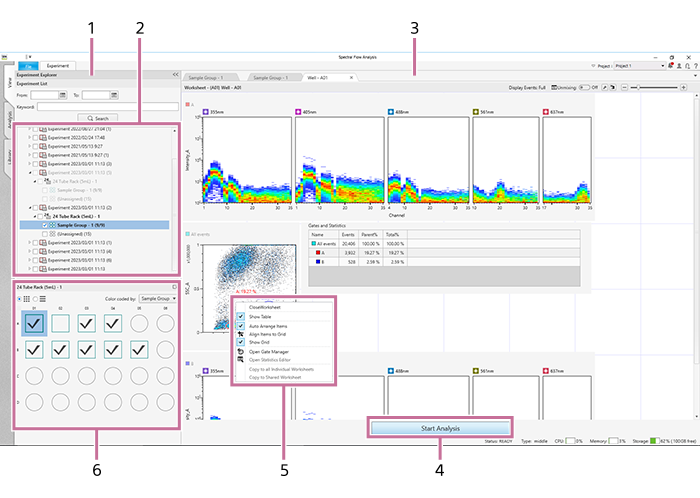
[View] Tab
The [View] tab is used to view the imported experiment data.
Hint
- You can only view data on the [View] tab. If you want to analyze the data, it is necessary to switch to the [Analysis] tab. For details about the operating procedure, see “Opening the [Analysis] Tab.”
-
[Experiment Explorer] pane
Selects data to view. You can also search experiments by date and keyword.
For details about the operating procedure, see “Searching Experiments.”
-
Experiment list
Displays the data of acquired experiments, analysis samples, and reports in list view.
-
Worksheet
This is the worksheet included in the data of the selected well/tube. Click the tab of the worksheet you want to view.
For details about the tools and information display that are common for worksheets, see “Toolbar” and “Status Bar.”
-
[Start Analysis]
Switches the experiment selected in the experiment list to the [Analysis] tab.
This button has the same function as [Start Analysis] displayed by right-clicking an experiment.
-
Context menu
For details about the menu items, see “Experiments.”
-
[Plate] panel
Displays a list of wells/tubes. You can switch the display to list view or map view.
The icon of a well/tube varies depending on the worksheet mode.
 : [Shared] mode
 : [Individual] mode
[Color coded by]
You can sort wells by color for selected metadata.

Displays the [Layout Editor] dialog where you can view the plate layout, sample information, metadata, and other information. See “[Layout Editor] Dialog”.