Displaying Multiple Spectral Data Overlaid
You can overlay spectral data of multiple plots on a single plot to compare analysis results.
- Click [Overlay Worksheet] in the [Overlay] group on the [Worksheet] tab of the ribbon and select the worksheet display method for overlays.
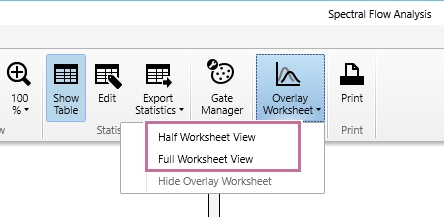
[Half Worksheet View]: Displays the overlay worksheet in the bottom half of the worksheet.
[Full Worksheet View]: Displays the overlay worksheet occupying the full area of the worksheet.
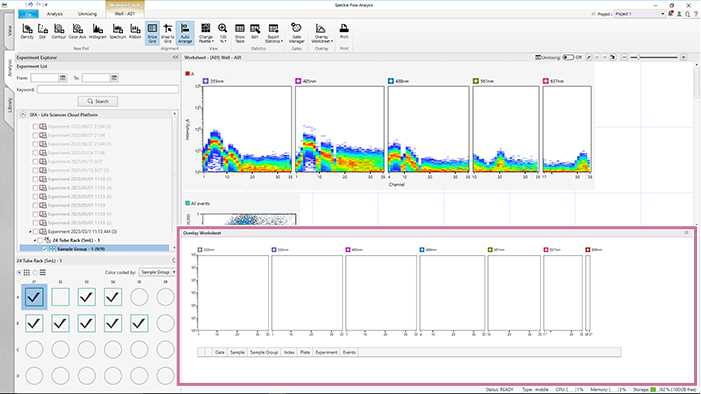
The overlay worksheet is displayed on the worksheet.
Display example: When [Half Worksheet View] is selected
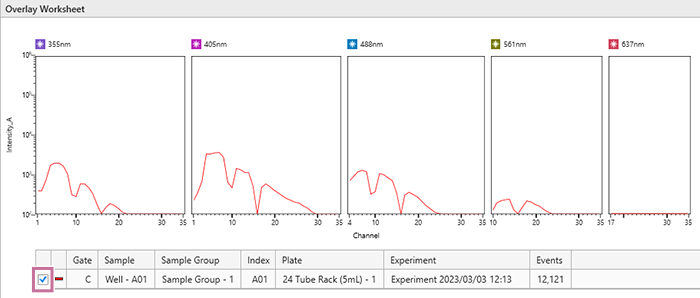
- Right-click a spectrum or ribbon plot with the spectral data to be overlaid, and select [Send to Overlay] from the context menu.
The spectral data is displayed in the plot of the overlay worksheet.
You can show/hide the spectral data by turning the checkbox in the legend on/off.
To delete spectral data
You can delete the spectral data using one of the following methods.
- Right-click a row in the legend of the overlay plot and select [Remove].
- Right-click within the overlay plot, and select [Remove All] from the context menu.
To change the spectral data type
Right-click within the overlay plot, and select [Change Data Type] - [Mean] (average), [SD] (standard deviation), or [CV] (coefficient of variance) from the context menu.
To export the overlay plot data as a CSV file
Right-click within the overlay plot, and select [Export Data to CSV File] from the context menu.
To copy the overlay plot and legend to the clipboard
Right-click within the overlay plot, select [Copy to Clipboard] – [Overlay Plot] or [Overlay Plot with Legend] from the context menu, and paste into another application.
You can paste the image into an external application, such as Microsoft PowerPoint or Microsoft Word.