Software Revision History
The history and details of software updates are as follows.
Functions Added in Version 1.1
The following functions have been added in Spectral Flow Analysis version 1.1.
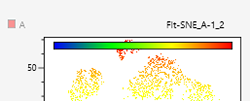
Color bar displayed on a color axis plot
The expression intensity can be easily understood due to the display of a color bar to show a legend on a color axis plot.
In addition, you can toggle between displaying and hiding the color bar in the [Plot Properties] dialog of the color axis plot.
For details, see, “[Plot Properties] Dialog (Properties for Color Axis Plots).”
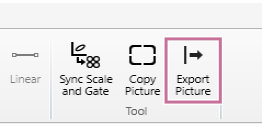
Exporting of a plot as a PNG-format image is possible
A function to directly export the selected plot as a PNG-format image (Export Picture) has been added to the [Plot] tab (ribbon).
Furthermore, [Export Picture] has also been added to the menu displayed by right-clicking within a plot.
Batch data cleaning is possible
Batch data cleaning for multiple samples can now be performed.
In addition, the setting information from when data cleaning was run has been added to the properties dialog of gates created by data cleaning.
For details, see “Running Batch Data Cleaning” and “[Gate Properties] Dialog (Properties for Gates Generated by Data Cleaning).”
Added data cleaning to pre-process of BL-FlowSOM, UMAP, and FIt-SNE
Data cleaning can now be specified as a pre-process for analysis using the BL-FlowSOM, UMAP, and FIt-SNE functions.
For details, see “[BL-FlowSOM] Dialog,” “[UMAP] Dialog,” and “[FIt-SNE] Dialog.”
Individual icon displayed on the gate tree of the plot and statistics table of a shared worksheet
Individual gates that have lost their shared link can now be visually identified on the gate tree of the plot and statistics table of a shared worksheet.
For details, see “Worksheet Modes.”